Ever find yourself asking “is this a front-end bug or a back-end bug?”, or wishing you could see the network tab of the tester who found it? HAR files are the answer.
Bugs are hardest when they happen on someone else’s machine. You can’t see what their browser sent, what came back, or in what order, so you end up guessing.
A .har file (HTTP Archive) is a JSON record of everything a browser exchanged with a site: request and response headers, cookies, query parameters, timings and more.
With one, you can see exactly what happened on the user’s side when the bug showed up, which usually tells you whether the front end or the back end is at fault.
To record one, open your browser’s developer tools and turn on “Preserve log” in both the Console and Network tabs.
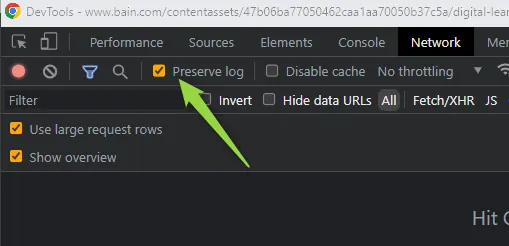
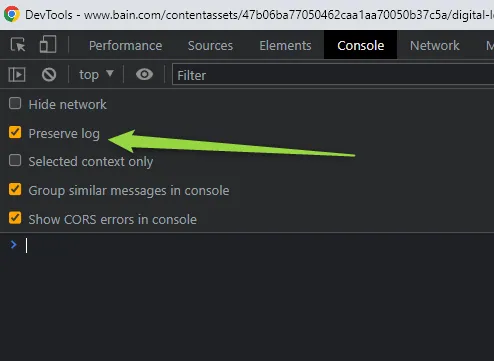
Then load the site, reproduce the problem, and save the network log as a .har file.
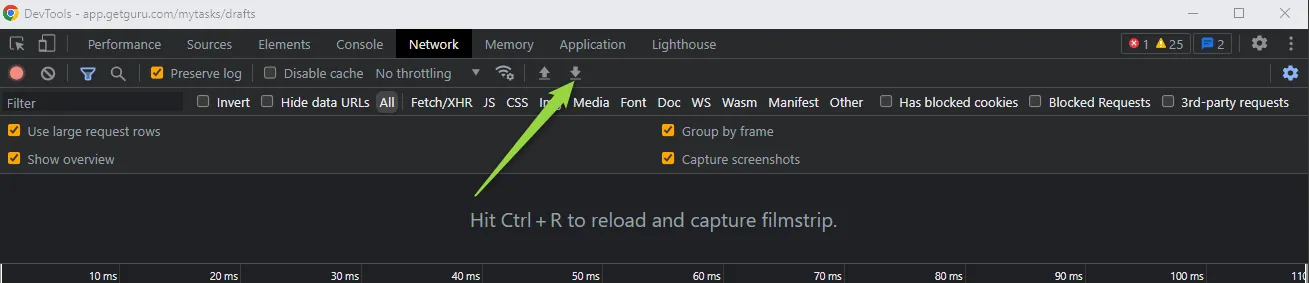
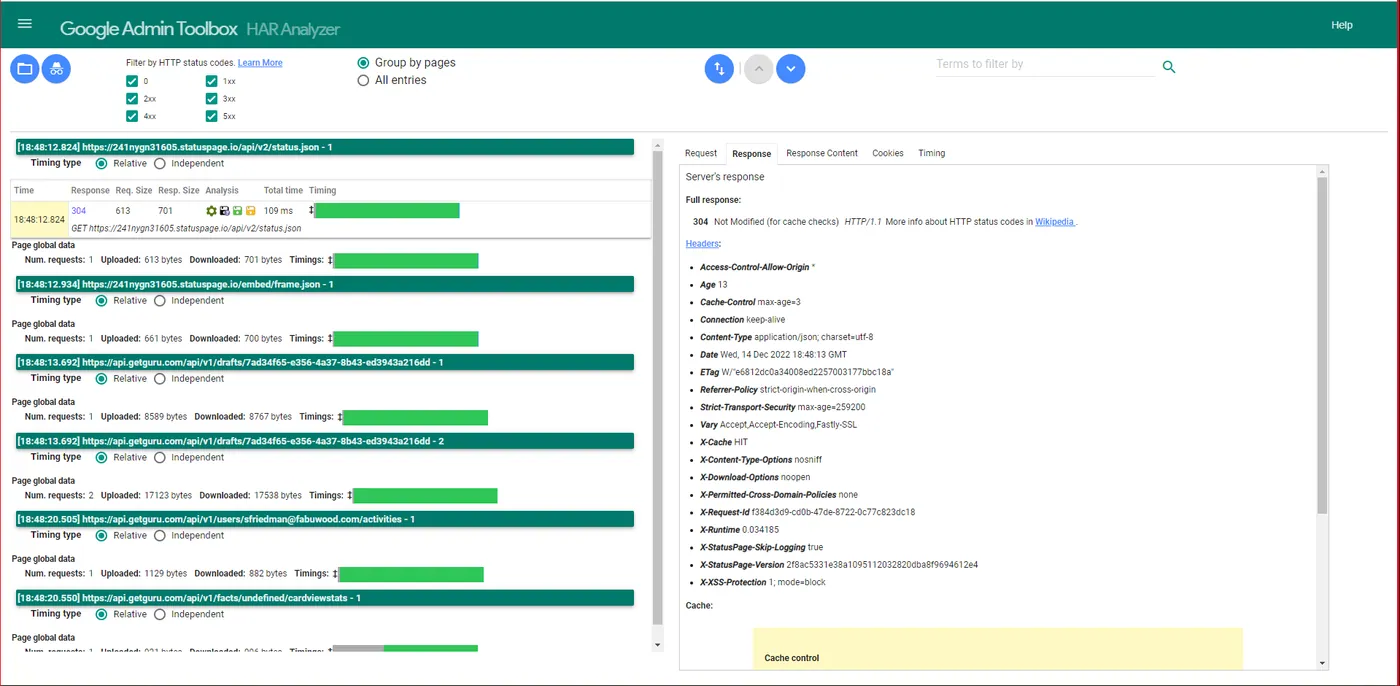
Share the file with whoever is fixing the bug. To read one, the easiest tool I’ve found is Google’s HAR analyzer.
You can also import a HAR file straight into the Network tab of your own developer tools.
